Comparing the Speed of U.S. Interest Rate Hikes (1988-2022)
Visualized: The World’s Population at 8 Billion
The Biggest Tech Talent Hubs in the U.S. and Canada
The Inflation Factor: How Rising Food and Energy Prices Impact the Economy
Ranked: The Most Popular Fast Food Brands in America
Ranked: The World’s Most Surveilled Cities
iPhone Now Makes Up the Majority of U.S. Smartphones
Visualized: The State of Central Bank Digital Currencies
The Evolution of Media: Visualizing a Data-Driven Future
33 Problems With Media in One Chart
Comparing the Speed of U.S. Interest Rate Hikes (1988-2022)
Mapped: The 3 Billion People Who Can’t Afford a Healthy Diet
Mapped: The World’s Billionaire Population, by Country
Charting the Relationship Between Wealth and Happiness, by Country
Mapped: A Snapshot of Wealth in Africa
Visualizing the Relationship Between Cancer and Lifespan
Explainer: What to Know About Monkeypox
Visualizing How COVID-19 Antiviral Pills and Vaccines Work at the Cellular Level
Mapped: The Most Common Illicit Drugs in the World
Visualizing The Most Widespread Blood Types in Every Country
The Top 10 EV Battery Manufacturers in 2022
Visualizing the Range of Electric Cars vs. Gas-Powered Cars
What is the Cost of Europe’s Energy Crisis?
All Electric Semi Truck Models in One Graphic
The Inflation Factor: How Rising Food and Energy Prices Impact the Economy
Map Explainer: The Caucasus Region
Mapped: The 3 Billion People Who Can’t Afford a Healthy Diet
Mapped: Countries With the Highest Flood Risk
Ranked: The 20 Countries With the Fastest Declining Populations
Iconic Infographic Map Compares the World’s Mountains and Rivers
Visualizing the World’s Largest Iron Ore Producers
Mapped: The 10 Largest Gold Mines in the World, by Production
The 50 Minerals Critical to U.S. Security
Visualizing China’s Dominance in Clean Energy Metals
The Periodic Table of Commodity Returns (2012-2021)
Animated Map: Where to Find Water on Mars
Mapped: Countries With the Highest Flood Risk
Visualizing China’s Dominance in the Solar Panel Supply Chain
All the Contents of the Universe, in One Graphic
Explained: The Relationship Between Climate Change and Wildfires
Published
on
By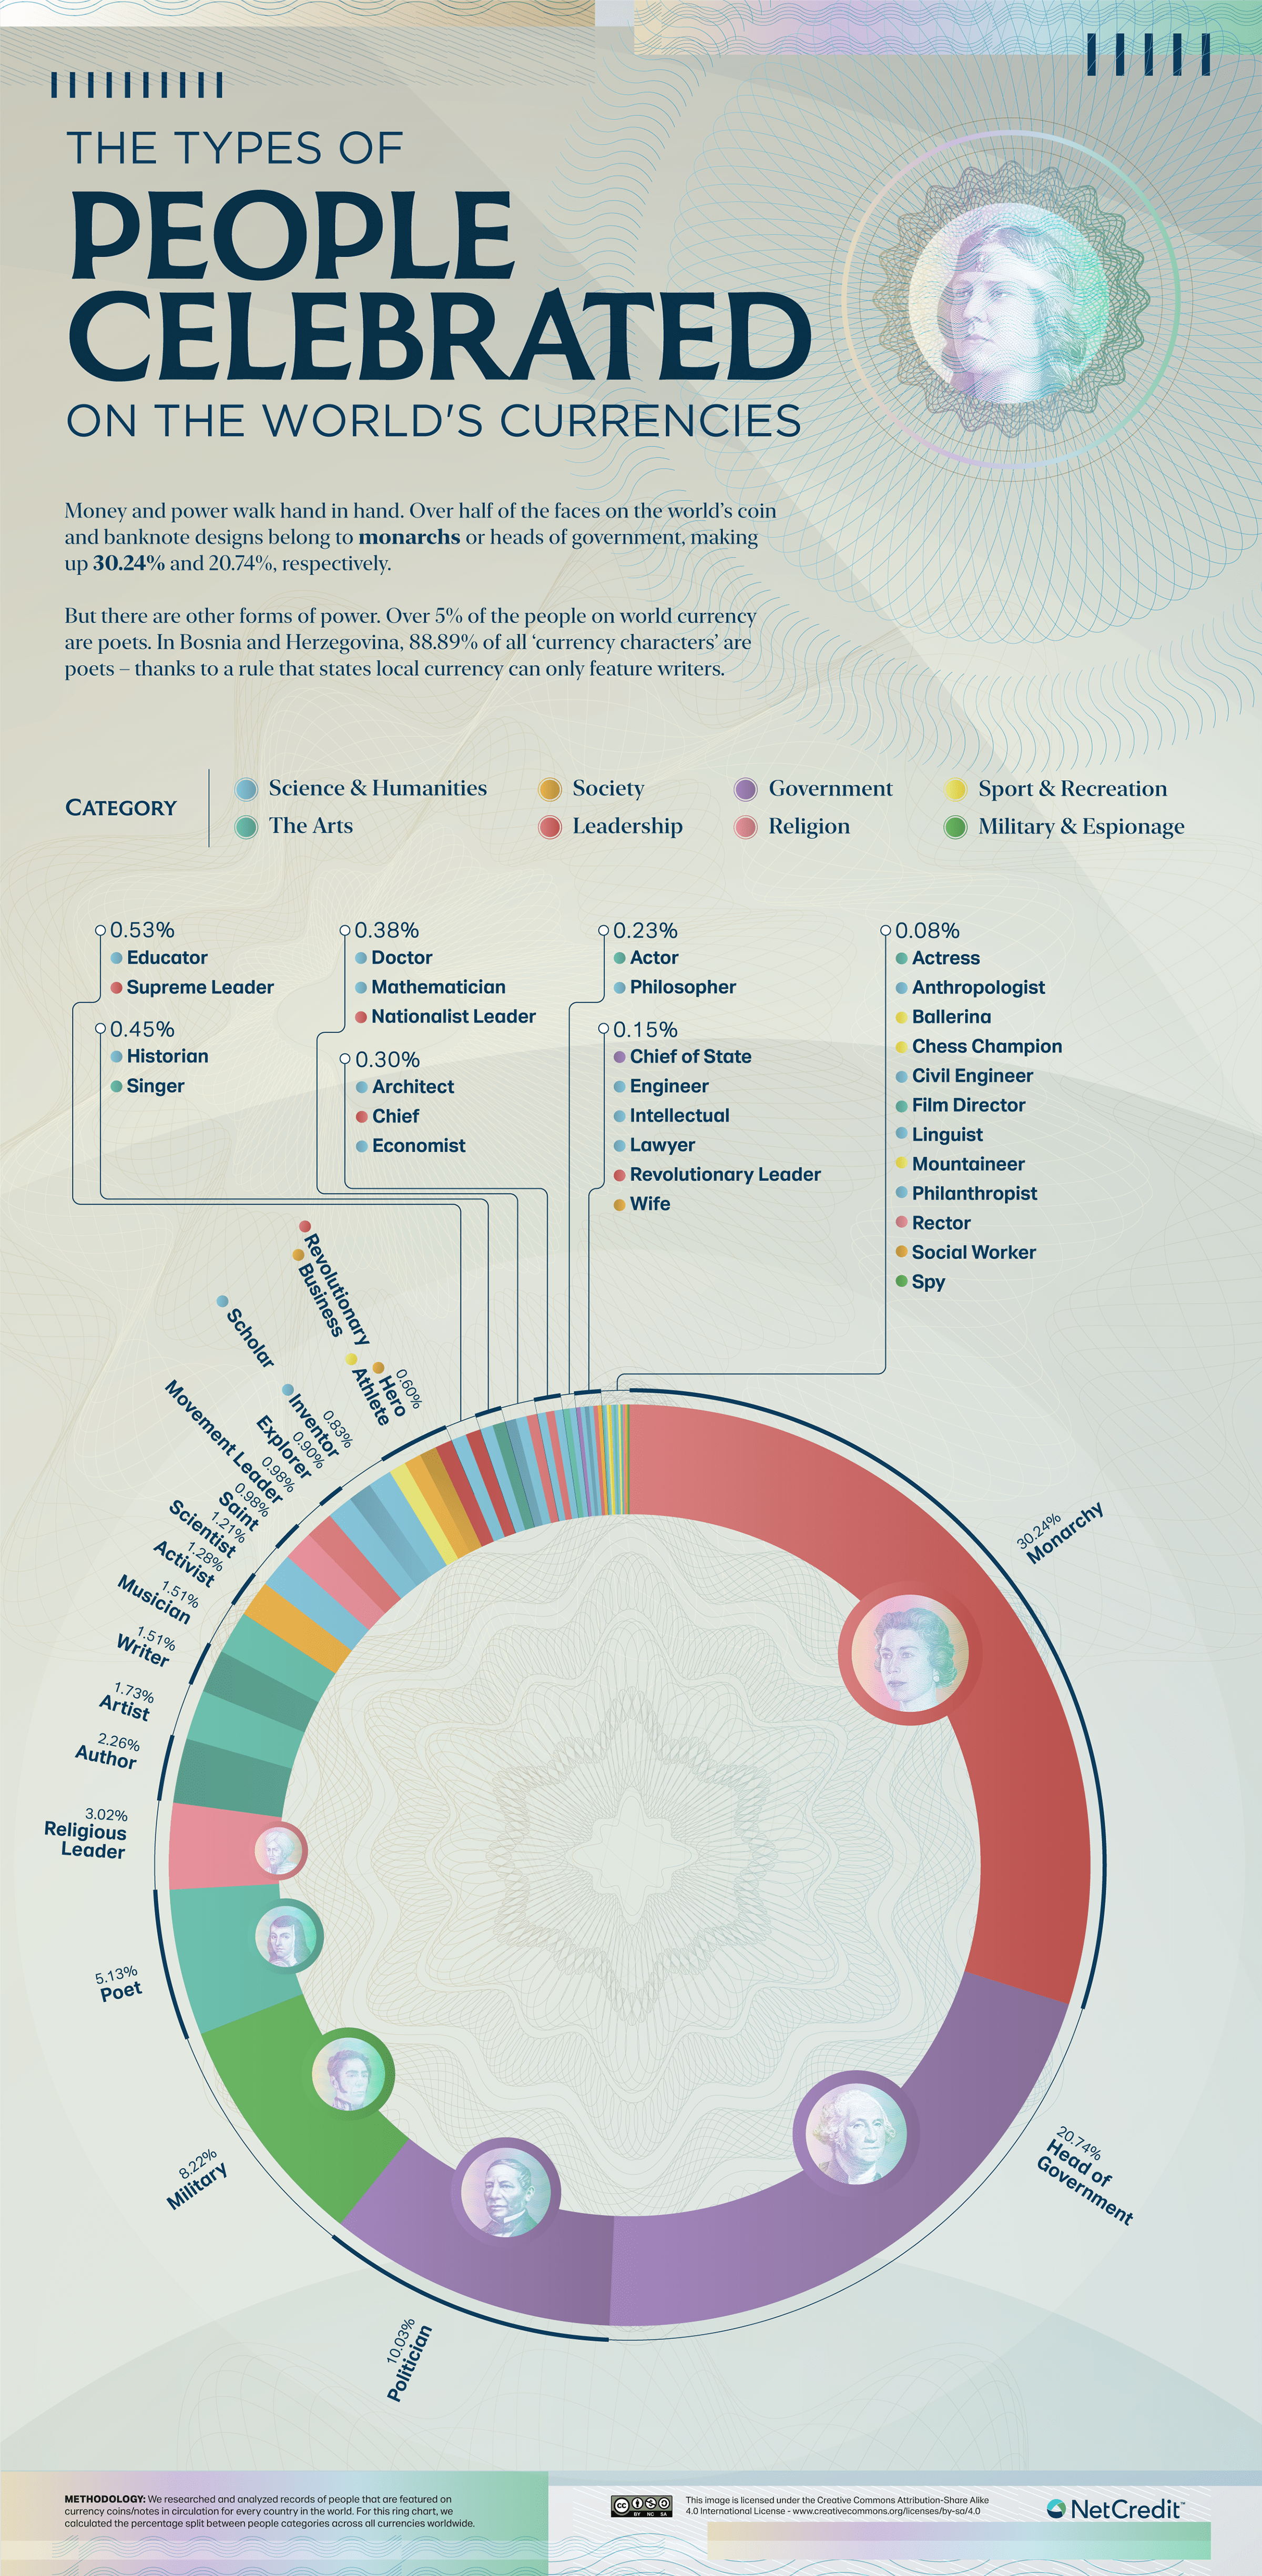
On currencies throughout the world, you’ll see everything from revolutionaries to poets featured prominently. But how does this mix of notable people break down quantitatively?
This graphic by NetCredit shows the types of people, by their main occupations and roles, that are featured on banknotes and coins worldwide.
To find out the types of people most featured on money, NetCredit analyzed all the banknotes and coins in circulation in every country across the globe in 2022.
From monarchs to athletes, the analysis found that many types of people appear on banknotes and coins worldwide. In fact, 51 different main occupations and roles were identified, which were then organized into eight overarching categories:
Here’s a breakdown of all 51 different occupations, and what percentage of worldwide currencies they’re featured on:
The analysis shows that over 50% of the people featured on money are either monarchs or heads of government, many of which are no longer in power.
For instance, Belize was once a British colony and still features the late Elizabeth II on all of its currency—even though the country gained independence from the UK in 1981.
And everyone featured on U.S. currency is also a historical figure. Putting living celebrities on U.S. money has been banned since 1866, after Spencer Clark, who was the Superintendent of the U.S. National Currency Bureau at the time, printed his own face on the 5-cent banknote instead of the explorer William Clark of “Lewis and Clark.”
Featured on over 100 different currencies around the world, the late Elizabeth II is the most featured person on banknotes and coins.
This makes sense considering the UK’s widespread historical reach. During the height of its reign in the early 20th century, the British Empire ruled nearly a quarter of the world.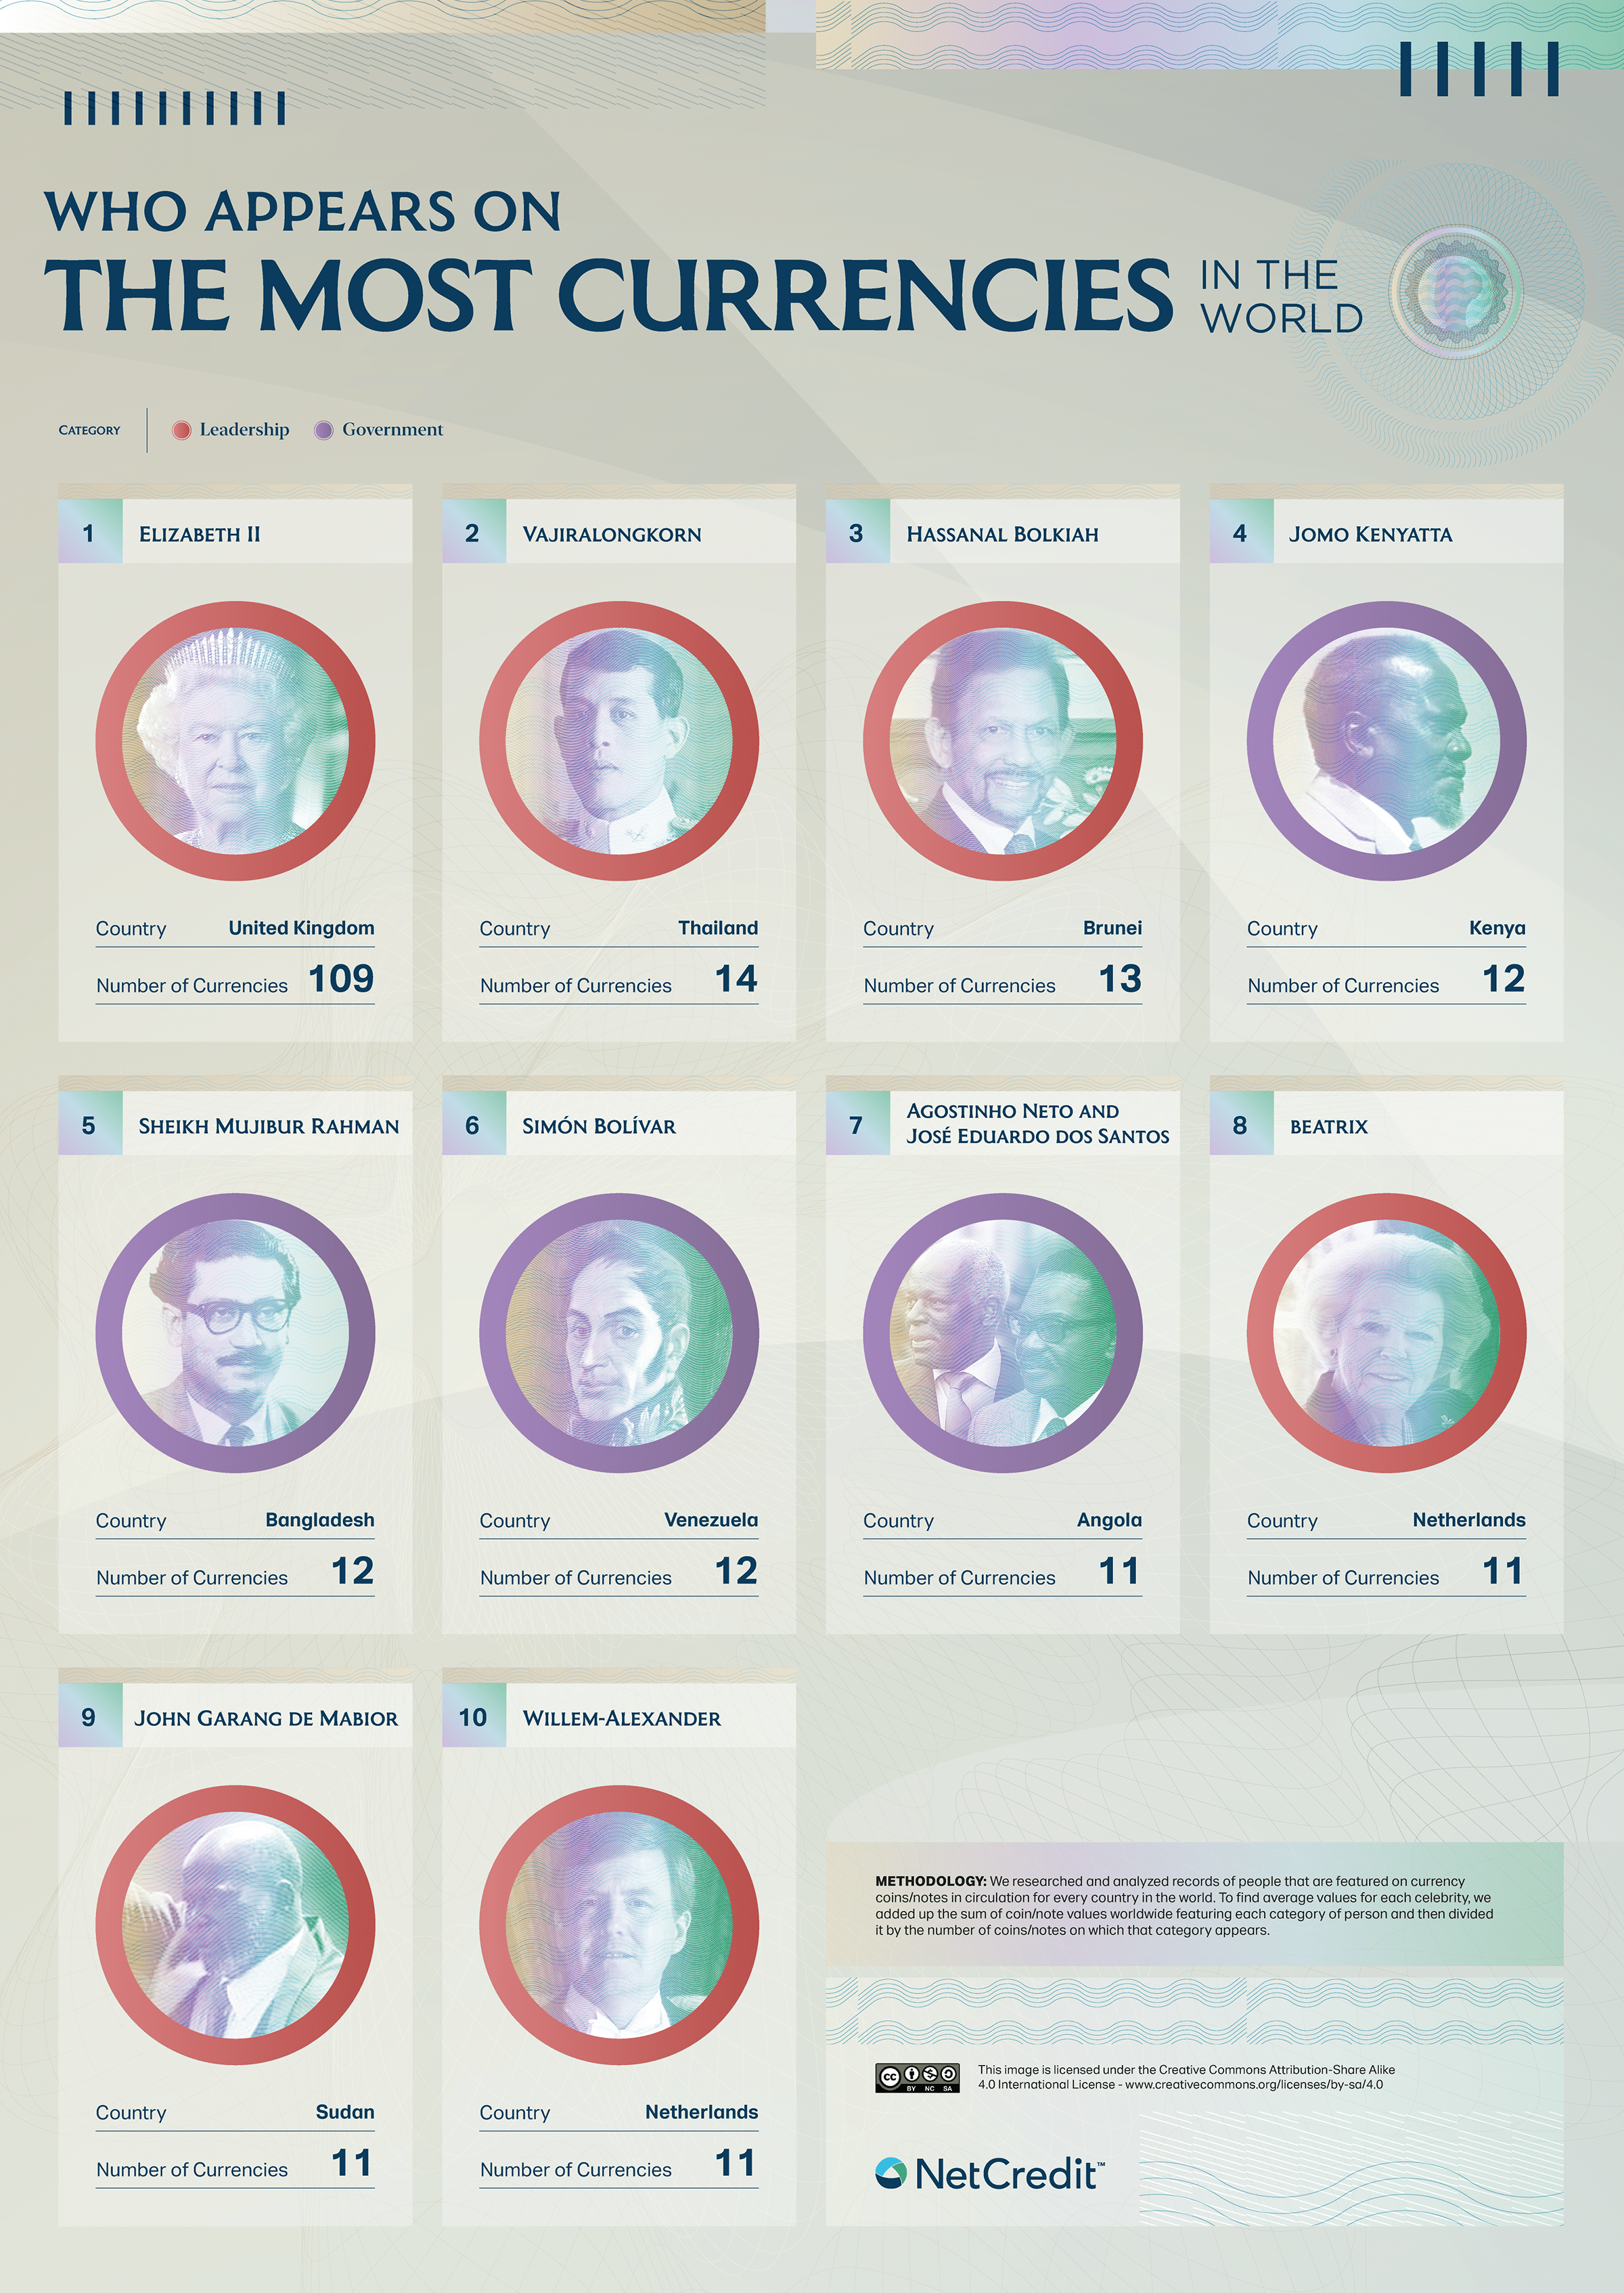
Perhaps unsurprisingly, 6 of the top 10 most-featured people on currencies are monarchs, while the rest are heads of government.
While Elizabeth II is the most featured person on currencies around the world, it’s worth mentioning that few other women have been given the same honor.
A study analyzed 1,006 current international banknotes and found that only 15% featured images of women.
However, some countries are actively trying to celebrate more women on their money. For example, the U.S. has been planning to put Harriet Tubman on the U.S. $20 bill for years, and while there have been some delays, the bill is currently on track to get released by 2030.
This article was published as a part of Visual Capitalist’s Creator Program, which features data-driven visuals from some of our favorite Creators around the world.
Mapped: Which Countries Still Have a Monarchy?
Charting the Relationship Between Wealth and Happiness, by Country
Mapped: The Wealthiest Billionaire in Each U.S. State in 2022
Who Are the Russian Oligarchs?
Billionaire Late Bloomers, by Age of Their Breakthrough
The Richest People in Human History, to the Industrial Revolution
What are the 50 best universities in America? From Harvard (#3) to The Ohio State University (#49), where does your school rank?
Published
on
By
The United States is home to many world-class universities like Harvard, Princeton, and Yale, which boast innovative research programs, famous alumni, prestigious awards, and students and faculty from all over the world.
But which schools are actually the best ones in America?
This ranking uses data from U.S. News & World Report to rank America’s 50 best universities from the Ivy League to public institutions. Additionally, this visual shows the average tuition and acceptance rate of each school.
Here’s a look at how different categories are scored in the ranking. It is worth noting that U.S. News relies on each university’s independent reporting of data and information and does not standardize or corroborate the reported information themselves.
How categories are weighted:
Ivy League universities are often assumed to be the top schools in America, but in reality, only four of the eight make the top 10.
Here’s a closer look:
One of the Ivies, Columbia University, actually dropped 16 spots from last year’s ranking due to a scandal involving misreported statistics by the university, which was exposed by one of its own professors. There have been critiques of the U.S. News & World Report ranking since, as it doesn’t provide a uniform set of standards for the universities, but lets them determine how they score their categories themselves.
Among the top 10 schools admittance is very competitive, and none of the acceptance rates surpass the 7% mark. Massachusetts Institute of Technology (MIT), Stanford University, and Caltech are among the most difficult universities to get into, with only 4% of applicants receiving that exciting acceptance letter. On the flip side, the universities of Illinois and Wisconsin, for example, accept 60% of all applicants.
A few more things to know—there are eight private schools in the U.S. that have earned the distinction of “Ivy League,” due to their history and prestige. A number of schools are also classified as land-grant universities—built on land which was essentially given to them by the U.S. government. This was in an effort to provide higher education to lacking communities across the country, and there is at least one in every state.
These are the U.S.’ eight Ivy League Institutions:
Beyond these prestigious academies, there are many high caliber institutions like The Ohio State University and the University of Wisconsin—both of which are land-grant universities.
Among the top 50, there are another four land-grant universities:
There is ripe controversy, however, surrounding land-grant universities, as, in many cases, the U.S. government funded these institutions through expropriated indigenous land.
U.S. college tuition is famous for being unaffordable. Combining all the federal and private loans in the country, the total student debt comes out to $1.75 trillion and the average borrower owes $28,950.
Here’s a look at how tuition breaks down on average: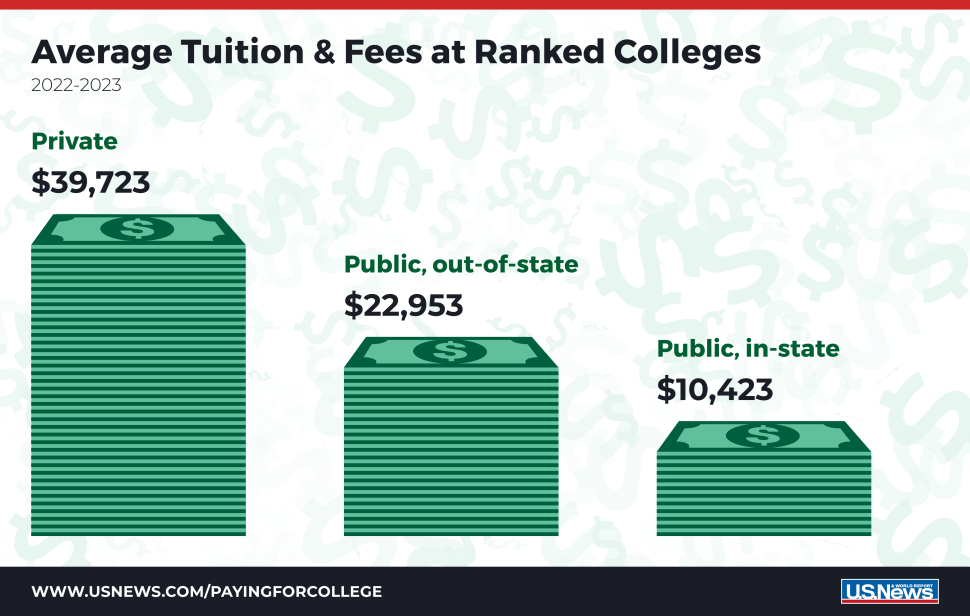
The most expensive school in America is Columbia University, with the cost of admission coming out to a whopping $65,524, with some estimates showing even higher rates for the 2022/2023 academic year. The least expensive among the top 50 is the University of Florida at $6,380 for in-state tuition—more than 10x cheaper than Columbia.
But many Americans may soon see their college loans forgiven. The Biden administration’s initiative to cancel student debt will roll out any day now and will be available on federal loans for select qualifying individuals. It has the potential to provide 40 million people with as much as $20,000 in debt forgiveness.
And given that American universities make up eight of the 10 best universities in the world, perhaps the price tag will be worth it.
This new planet-wide animated map, based on a decade of space agency research, shows where water can be found on Mars.
Published
on
By
The hunt for water on Mars has always been a point of interest for researchers.
Earth has life almost everywhere water exists. Water is an ideal target for finding lifeforms, like microbes, that may exist on other planets.
And if Mars is to become a future home, knowing where water exists will be necessary for our survival.
Both NASA and the European Space Agency (ESA) have special instruments searching for water on the red planet. After 10 years of in-depth investigation, their latest findings suggest a new “water map” for Mars.
Many people know Mars as a dry and dusty planet, but it hasn’t always been that way.
Approximately 4.1 to 3.8 billion years ago, Mars had a massive ocean called Oceanus Borealis. It dominated the northern hemisphere of the planet. Specific planetary conditions at that time let water exist on its surface. Changes in temperature, climate, and geology over the years gradually pushed water out to the atmosphere or into the ground.
Up to 99% of this ocean water is trapped within the planet’s crust, locked within special rocks called hydrous minerals.
Hydrous minerals are essentially rocks that have water (or its two main elements, hydrogen and oxygen), incorporated into their chemical structure.
There are four main classes of hydrous minerals: silicates, sulfates, silicas, and carbonates. While these minerals look pretty similar to the naked eye, their chemical compositions and structural arrangements vary. They are detectable by sophisticated equipment and can tell scientists how water geologically changes over time.
The new water map of Mars actually highlights the location of these hydrous minerals. It is a geological map of the rocks that are holding what remains of Mars’s ancient ocean.
Despite being a “graveyard” for the bulk of the planet’s ocean, hydrous minerals are not the only source of water on Mars.
Water ice is present at both of Mars’s poles. The northern polar ice cap contains the only visible water on the planet, while the southern pole covers its water with a frozen carbon-dioxide cap.
In 2020, radar analyses suggested the presence of liquid water, potentially part of a network of underground saltwater lakes, close to the southern pole. In 2022, new evidence for this liquid water suggested that the planet may still be geothermally active.
More frozen water may be locked away in the deep subsurface, far below what current surveying equipment is able to inspect.
The new water map is highlighting areas of interest for future exploration on Mars.
There is a small chance that hydrous minerals may be actively forming near water sources. Finding where they co-exist with known areas of buried frozen water provides possible opportunities for extracting water.
ESA’s Rosalind Franklin Rover will land in Oxia Planum, a region rich in hydrous clays, to investigate how water shaped the region and whether life once began on Mars.
Many more investigations and studies are developing, but for now, scientists are just getting their toes wet as they explore what hydrous minerals can tell us of Mars’s watery past.
Visualized: The World’s Population at 8 Billion
Top 20 Countries With the Most Ultra-Wealthy Individuals
Ranked: The World’s Most Surveilled Cities
Charted: The World’s Most Populous Countries (1973–2023)
The Biggest Tech Talent Hubs in the U.S. and Canada
Mapped: Which Countries Still Have a Monarchy?
Visualizing the Range of Electric Cars vs. Gas-Powered Cars
Comparing the Speed of U.S. Interest Rate Hikes (1988-2022)
Copyright © 2022 Visual Capitalist